Data has recently been released on the 2023 levels of equity raised for UK companies.
All the data and graphs have been produced by MarktoMarket, the Edinburgh based data platform and marketplace who provide intelligence to those operating in the SME markets.
Assumptions
In terms of the assumptions for the data and how it has been segmented, the following has been used as a base by MarktoMarket:
- Data relates to new capital raise into start-up or scale up businesses
- Data picks up raises above £250K
- Pre Seed is viewed as £250k – £1m
- Seed is viewed as £1m – £3m
- Series A is viewed as £3m – £10m
- Series B+ is viewed as £10m+
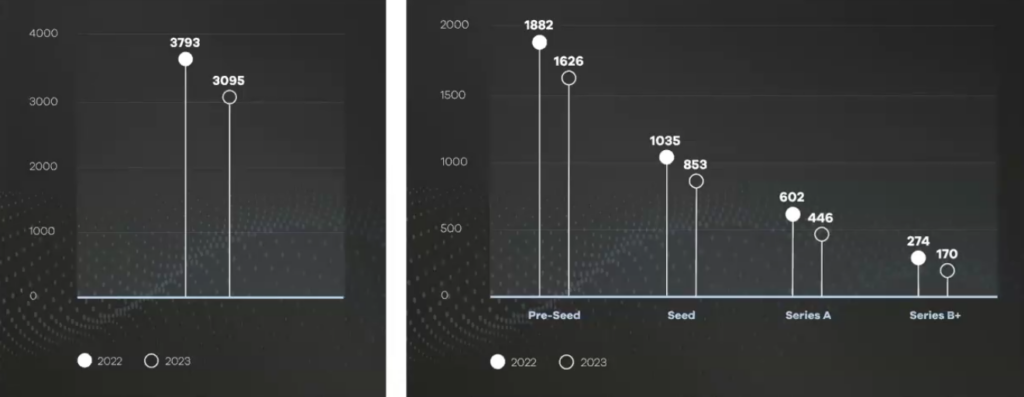
Deal Volume
The graph shows the total number of deals in 2023 compared to 2022 and also then a break down of those deals in each of the stages from Pre-Seed to Series B+.
As can be seen the deal volumes are down 18% year on year with 3095 deals versus 3793 from the year before. All stages are down, with the later stages down even more with Series A down 25% and Series B+ down by 38%. One of the reasons why the later stages are down is due to the ‘need’ for fundraising. Generally earlier stage businesses have to raise their finance because they need it, whereas later stage businesses may be able to time their raise better and potentially delay where market forces are against them.
Some of these numbers may ultimately increase slightly because some companies file their Companies House information later than they are supposed to and therefore there will be some late additions, but certainly nothing that will change the overall picture by much.
The Quarter 4 numbers for 2023 were also down and when you take into account any delayed submissions, they are likely to mirror the full 2023 trends.
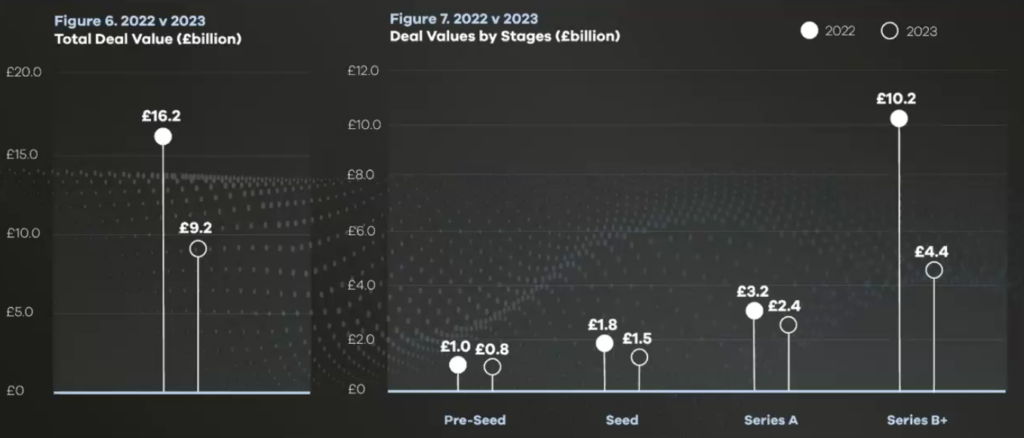
Deal Value
Deal value numbers show initially an even starker picture. They are down 43% at £9.2bn versus £16.2bn the year before.
However, in this case it is very much weighted towards the later stage deals. Series B+ deals are down 57%, whereas the Pre Seed, Seed and Series A show much smaller falls. Still down but nowhere near as much.
As mentioned in deal volumes, there will be some increase in these numbers when the late submissions are added, but again not expected to be significant.